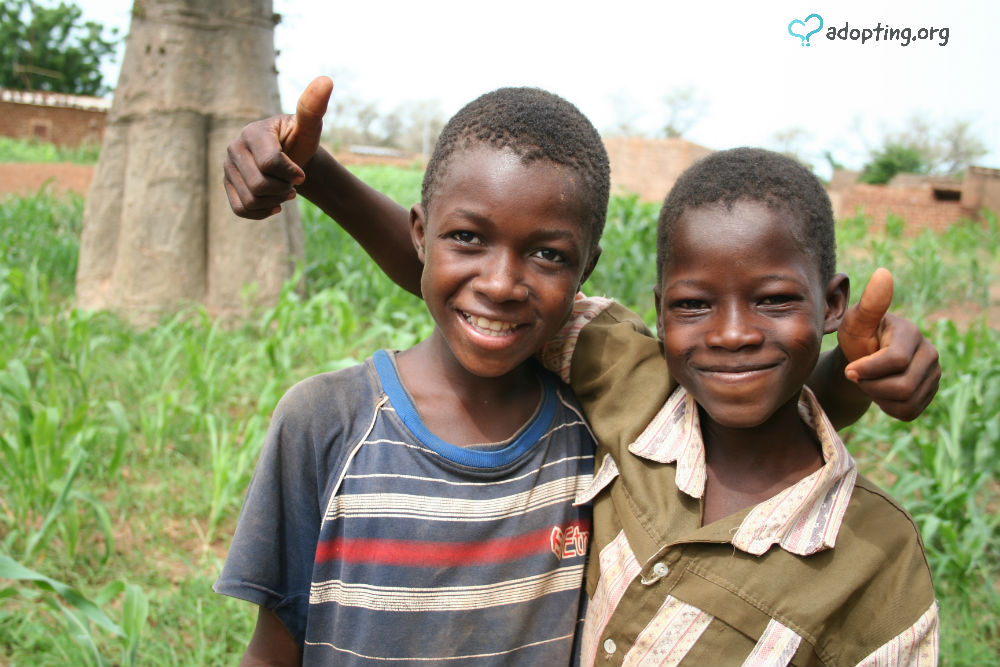
When beginning the process of international adoption it seems like the possibilities are endless. As prospective adoptive parents are you drawn to Asia, South America, or maybe Africa? Which continent speaks...

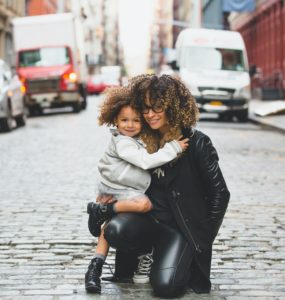
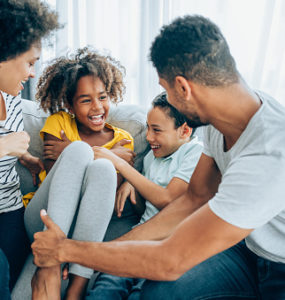
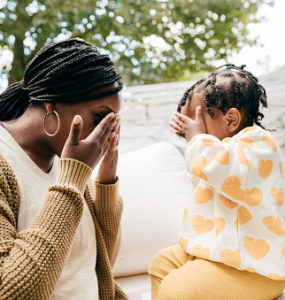
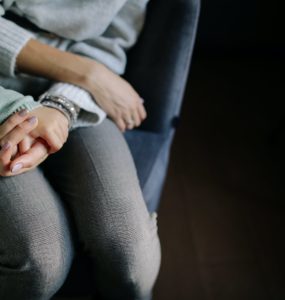
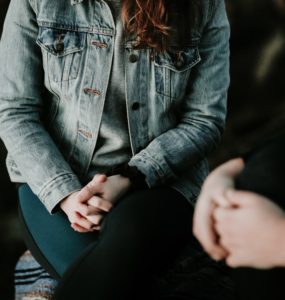
Interview with a Single Foster Mother
This woman is someone I’ve known and loved since high school. So, for a long time. She’s a single foster mom and a nurse. She amazes me. I got to ask her a few questions and she was gracious enough to answer with...